

In the dashboard: Templates → Template Tools → Cost to Cure table, or in a report: Report Tools → Cost to Cure table
What Cost to Cure does
Cost to Cure puts your own repair prices in the report. You type an estimated cost and a timeframe on a defect. Hive shows them on that defect, and the Cost to Cure table gathers every priced defect into one table near the top of the report. It works in both the digital report and the PDF. Commercial clients often ask for it, but you can use it on any template.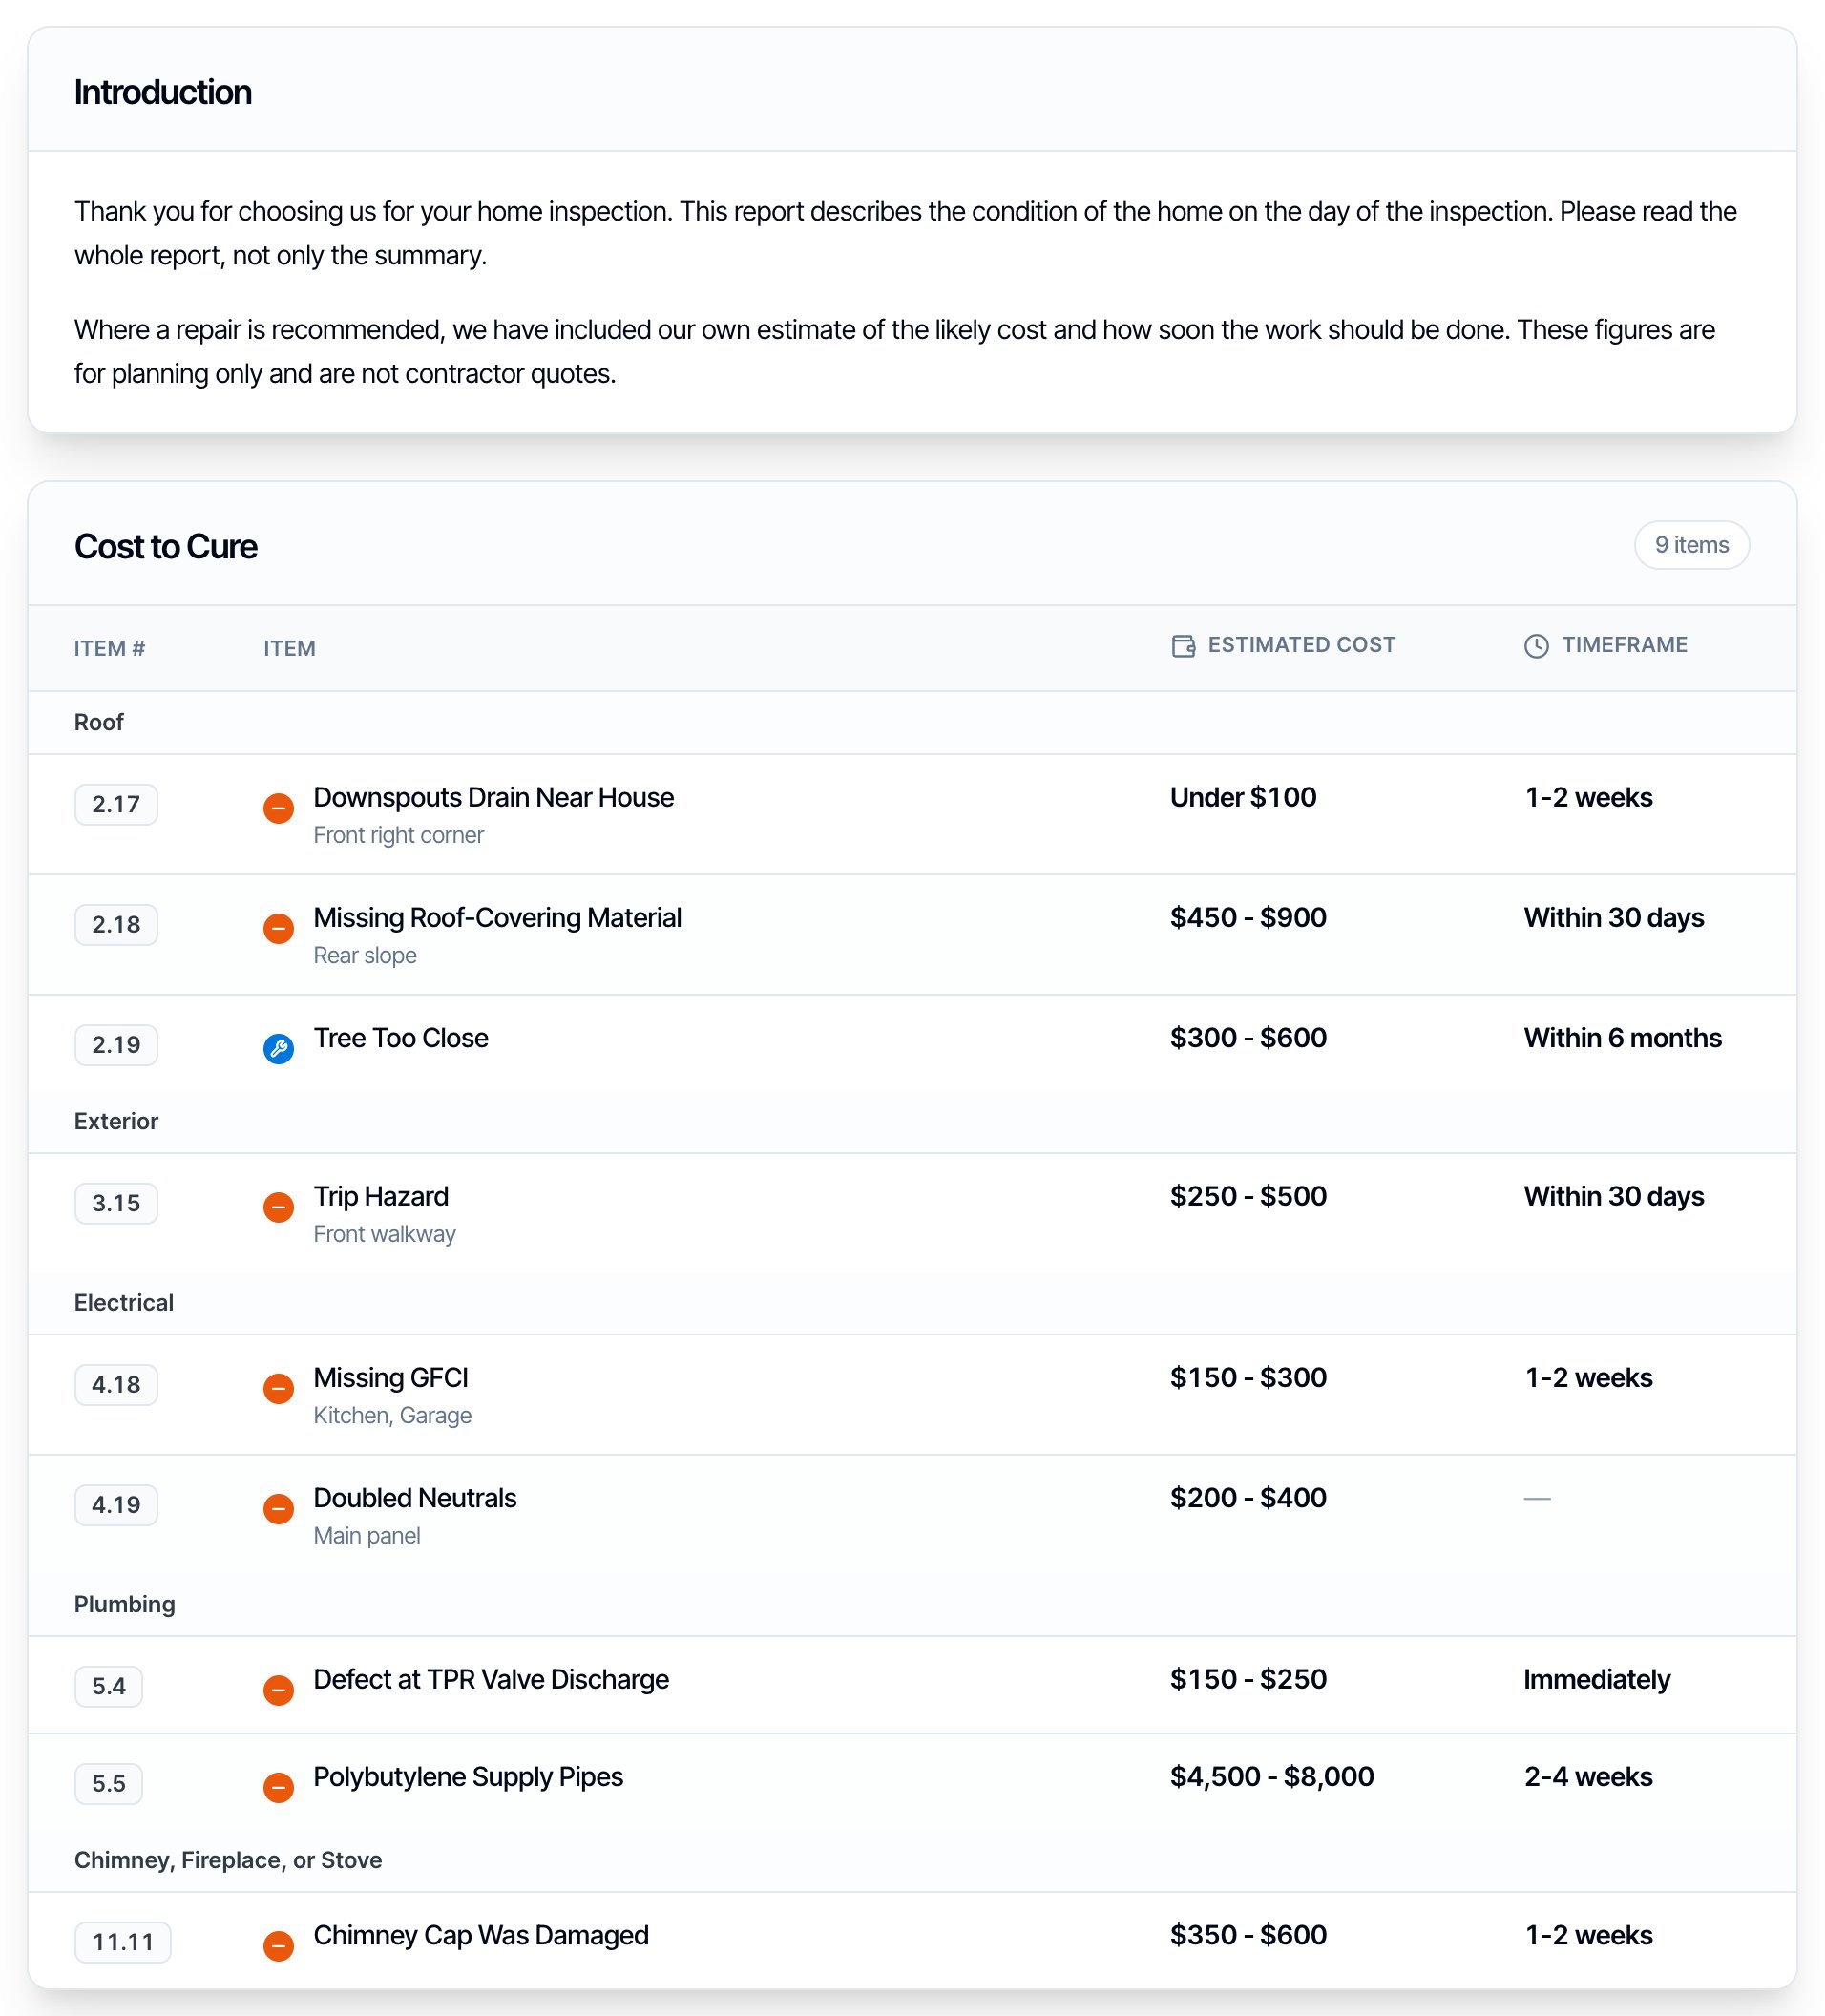
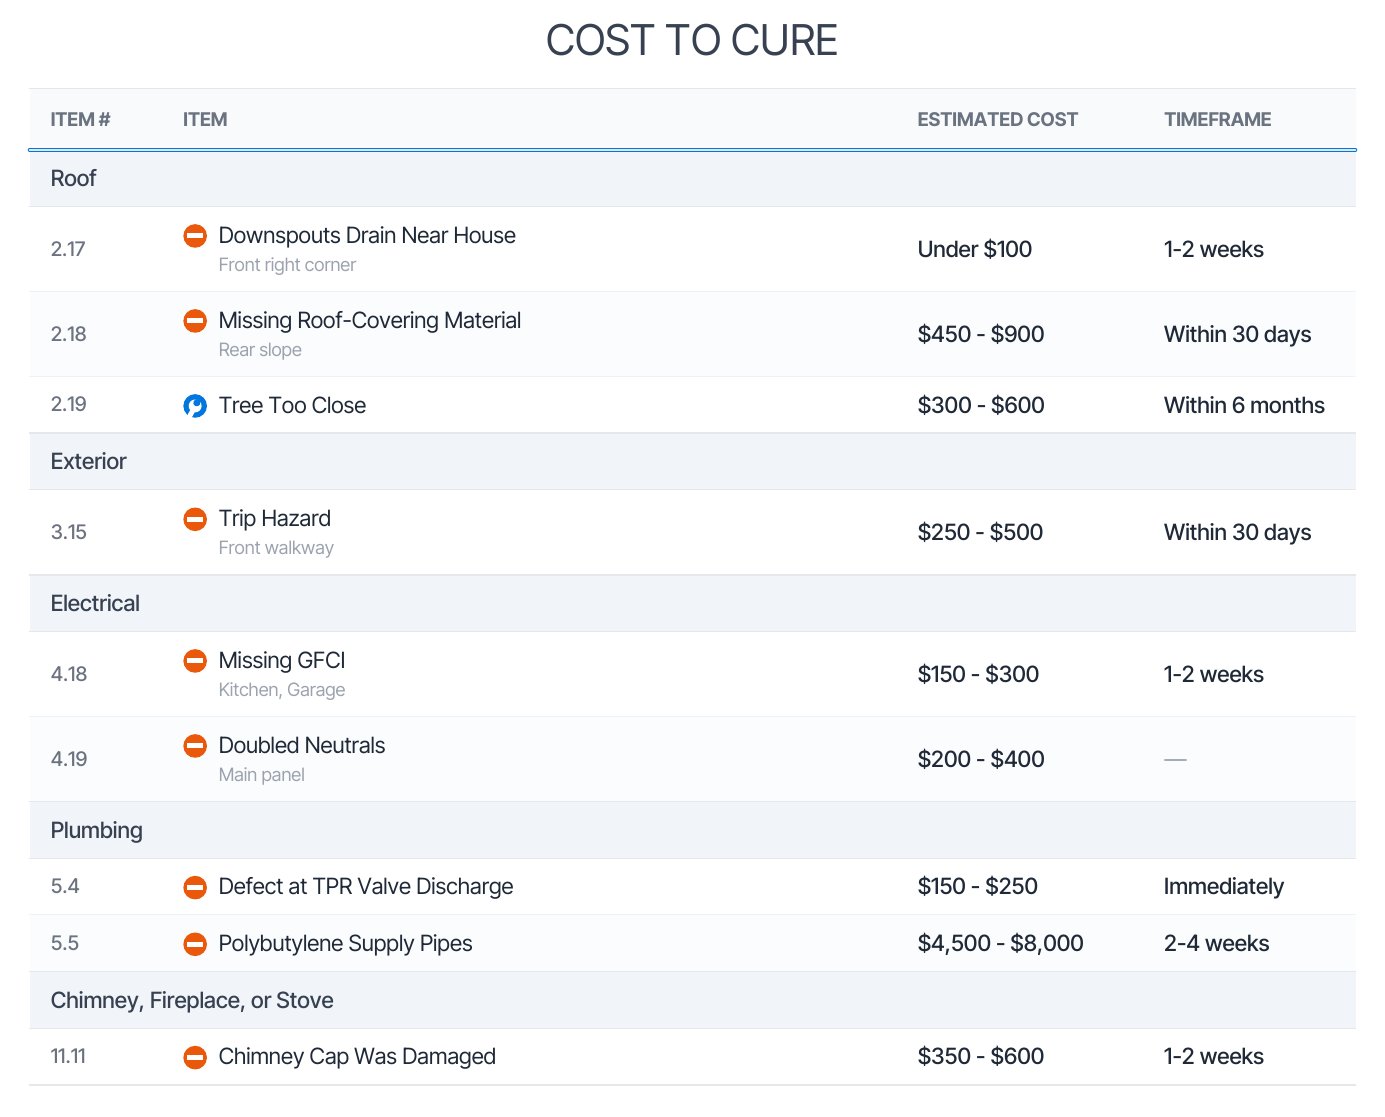
- Item #. The same number the defect has in the body of the report.
- Item. The defect name, with its location tags underneath and its category marker beside it.
- Estimated Cost. What you typed for that defect.
- Timeframe. What you typed as the estimated timeline.
Cost to Cure or the Repair Estimator?
Both give your client repair costs. The difference is who sets the price.
You can use both on the same report. They don’t affect each other. The Repair Estimator does not read the costs you typed, and your costs are never changed by it. See Send a repair estimate.
How the two parts fit together
The switch only controls the table. With the switch off, a cost you typed still shows on its own defect.
Add your cost and timeframe to a defect
You can do this in three places. Use the template for prices you quote the same way on every job, and the report for prices that depend on the property.In the template
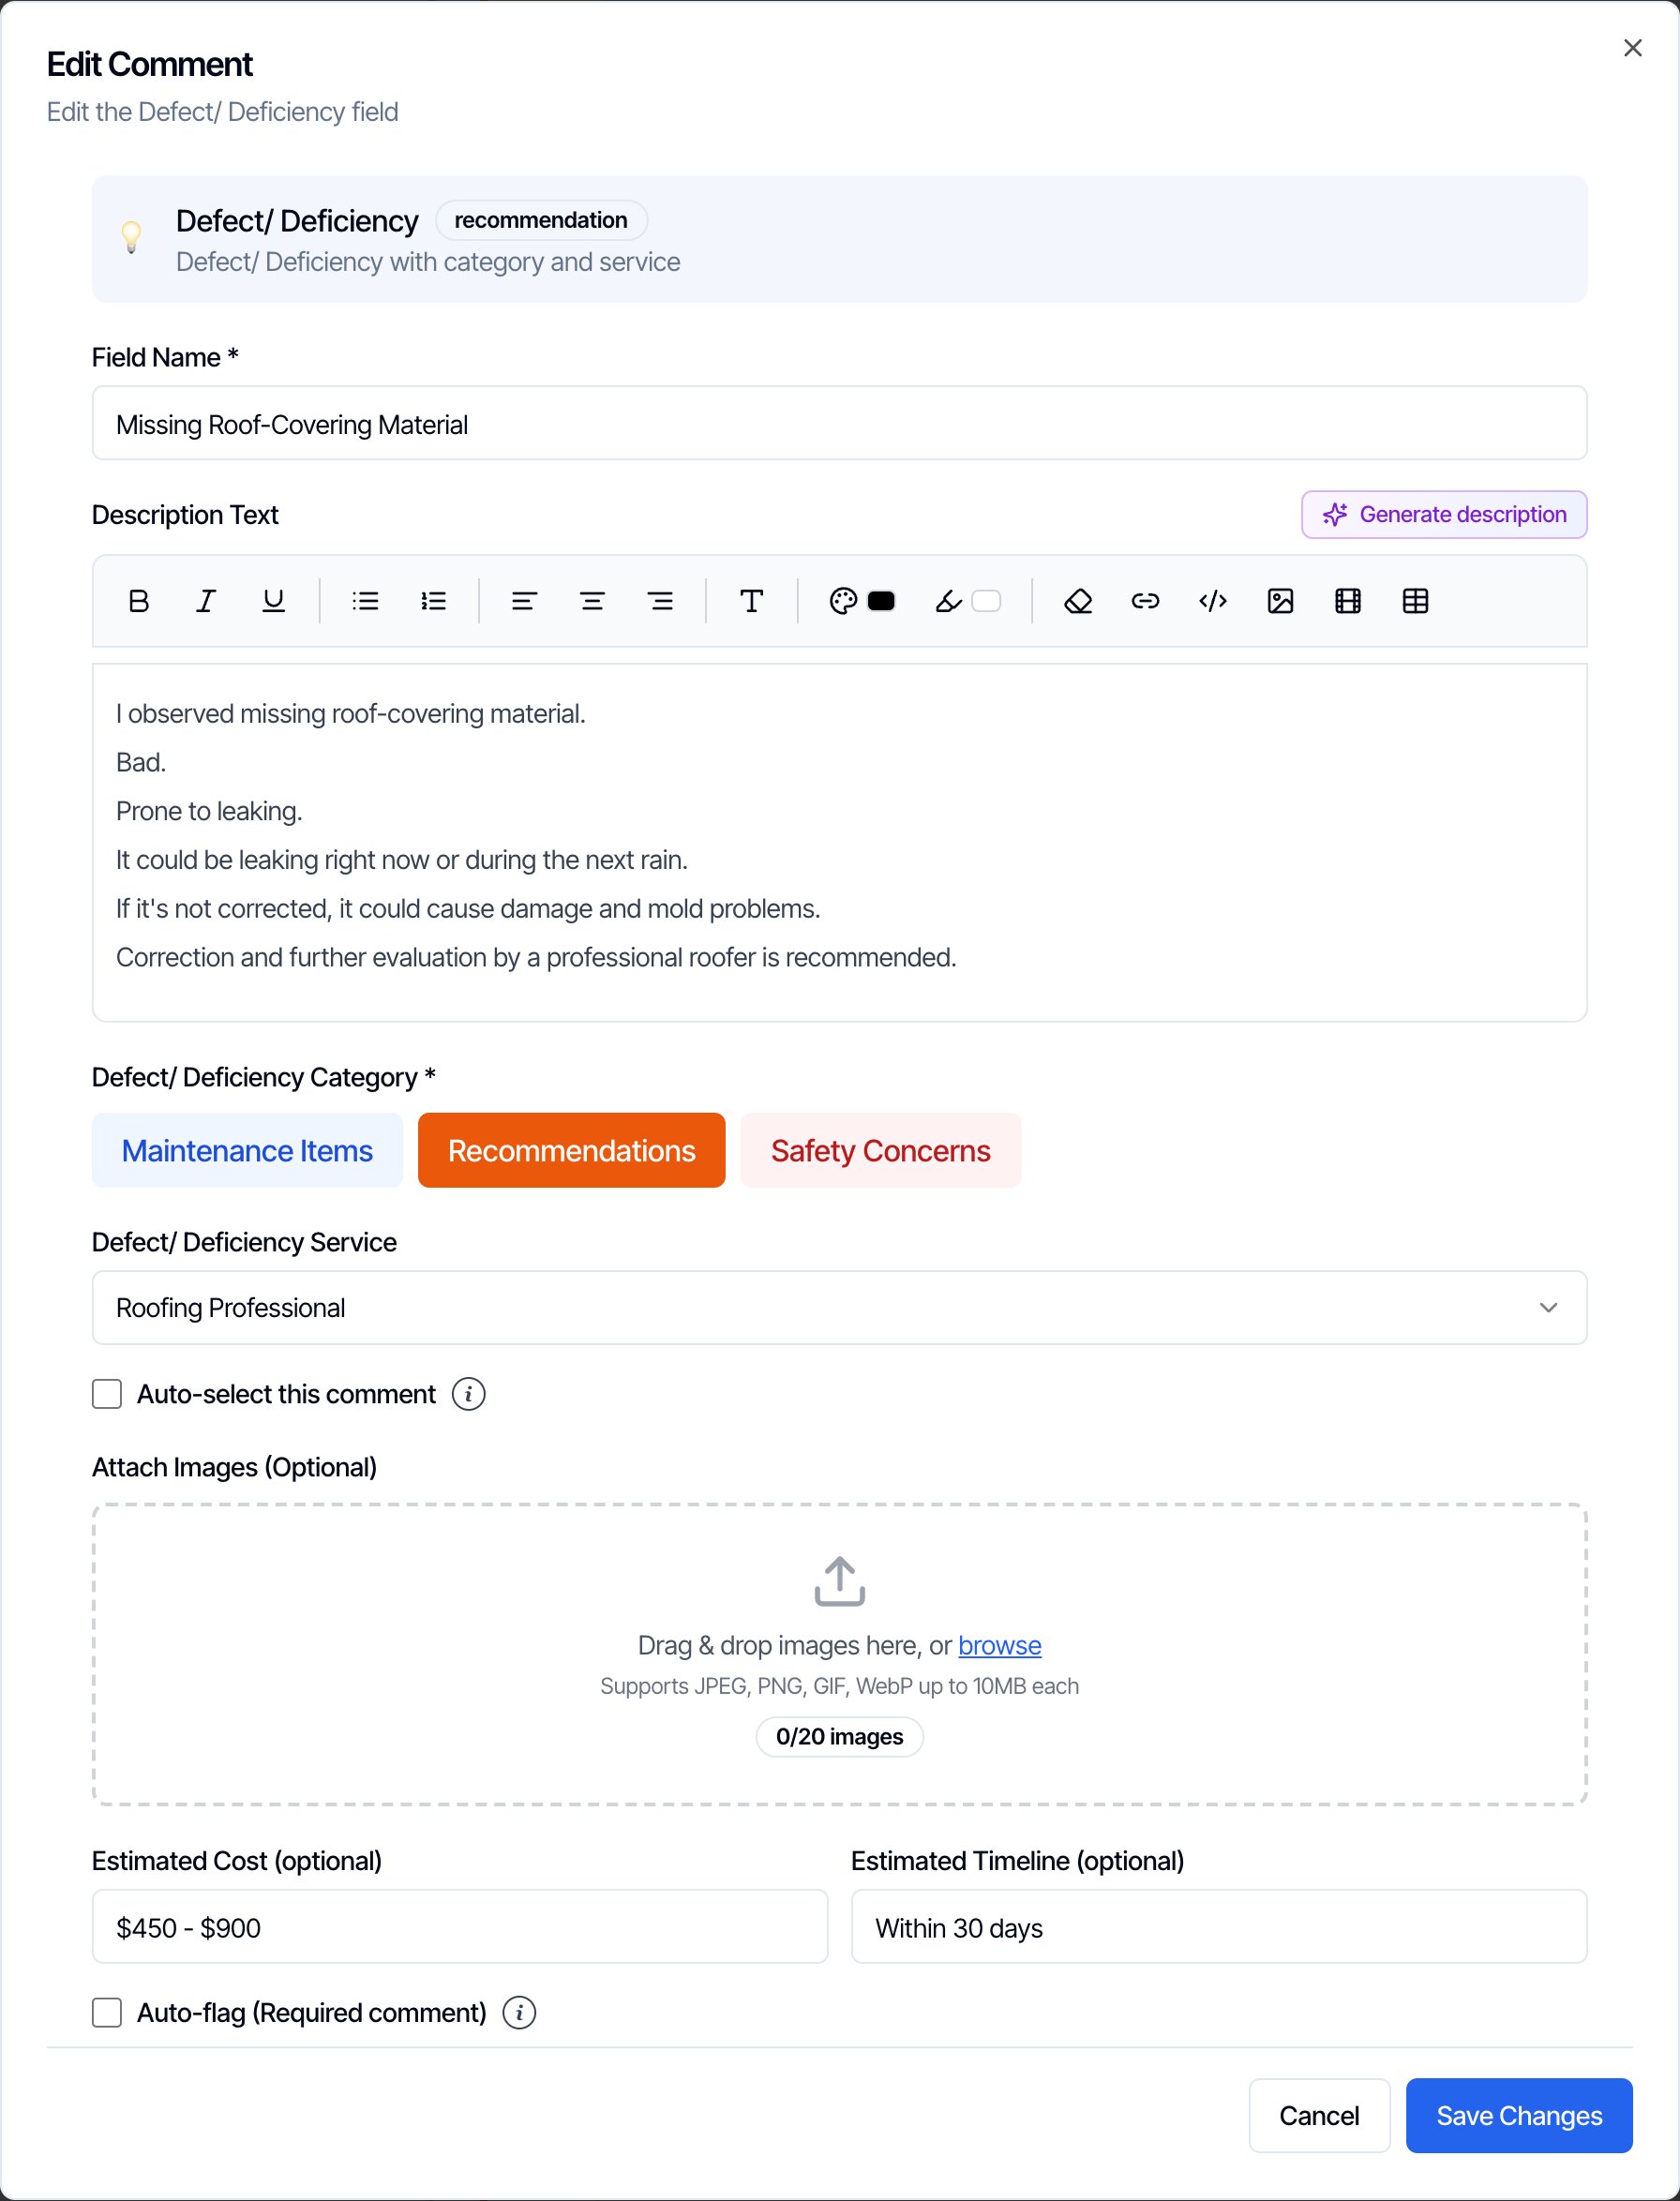
Costs you save in the template are already filled in on every new report from it. You can still change them on any report.Open the defect comment
- Click Templates in the sidebar and open the template.
- Open the section and subsection that holds the defect comment.
- Click the edit (pencil) icon on the comment.
In the Web Editor
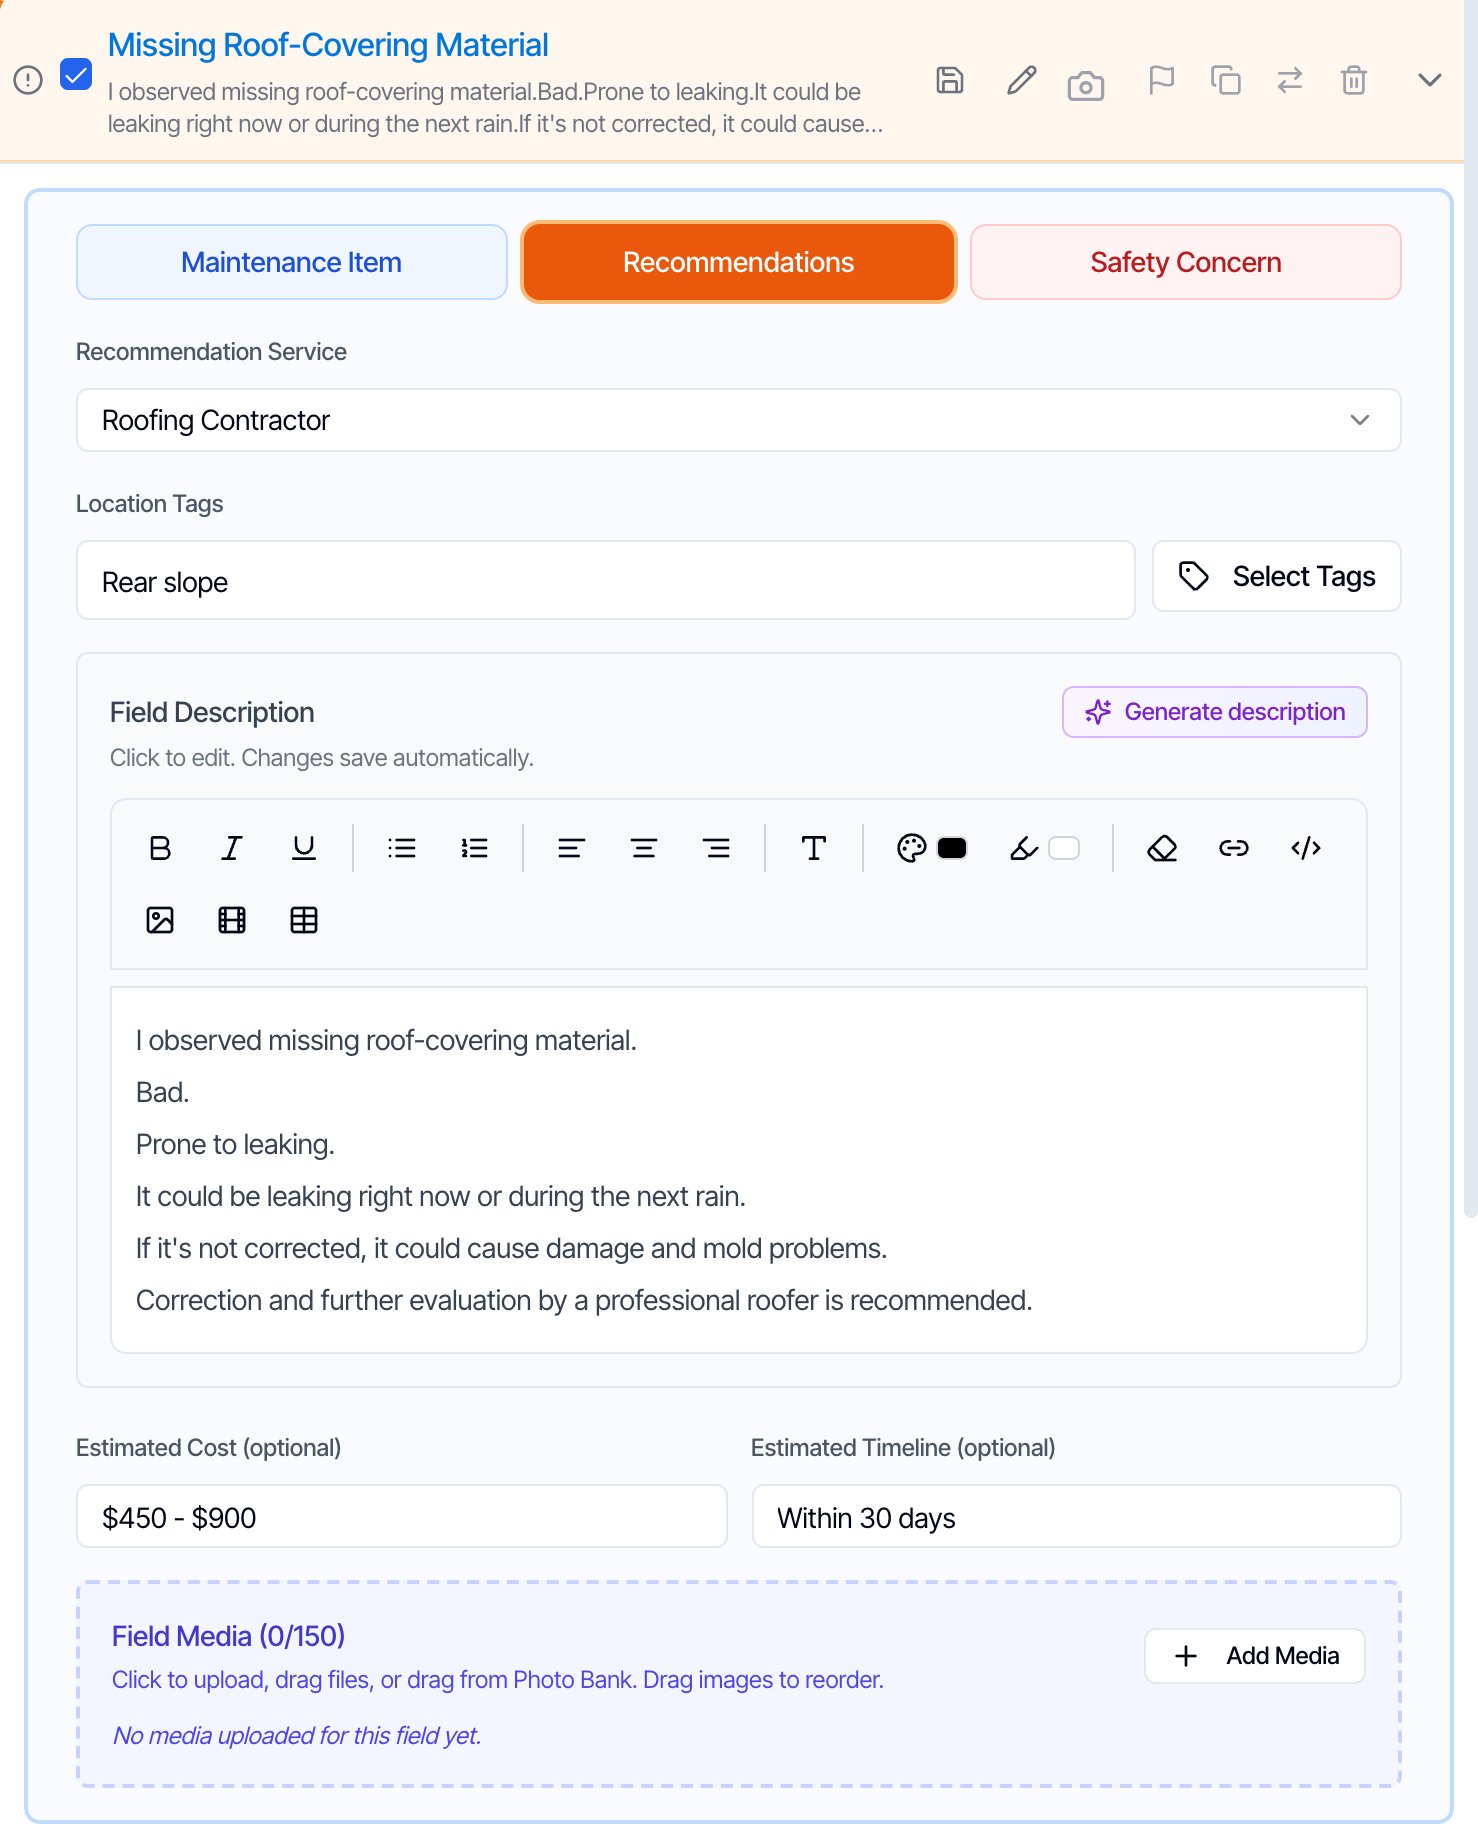
- Open the report in the Web Editor and expand the defect comment.
- Estimated Cost (optional) and Estimated Timeline (optional) are below the description.
- Type your values. They save with the report.
- The same two fields are in the Add Comment dialog when you add a new defect.
In the mobile app
- Open a defect comment in the report. Est. Cost and Est. Timeline are below the category and service.
- Type a value and tap out of the box. It saves and syncs like any other change.
- The same two fields are at the bottom of the form when you add a new defect comment.
What to type
Both fields are plain text. Hive shows exactly what you type. It does not add a currency sign, format the number or add anything up.
Both fields are optional. Leave them empty on any defect you don’t want to price.
What your client sees on the defect
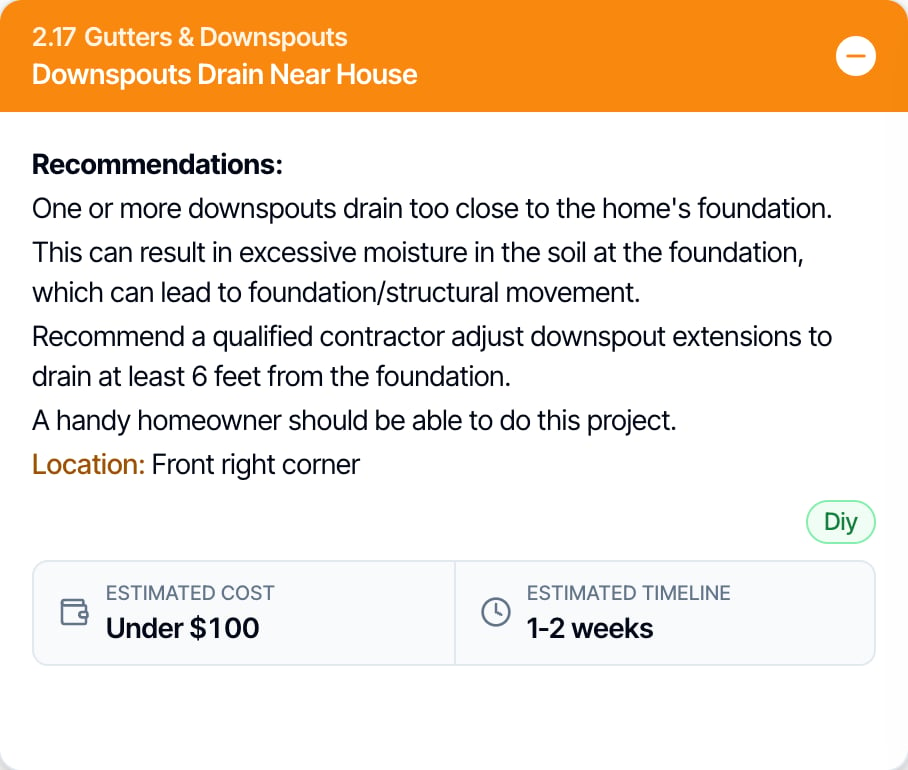
- In the digital report, the defect shows an Estimated Cost and Estimated Timeline strip.
- In the PDF, the defect shows Estimated Cost: and Estimated Timeline: lines after its location.
- Only the fields you filled in are shown.
Turn on the table for a template
Do this once for each template. Every new report from that template then starts with the table on.Open Template Tools

- Click Templates in the sidebar and open the template.
- On the Overview screen, click Template Tools at the top right.
- If you have unsaved changes in the template, Template Tools asks you to save or discard them first.
Click Cost to Cure table
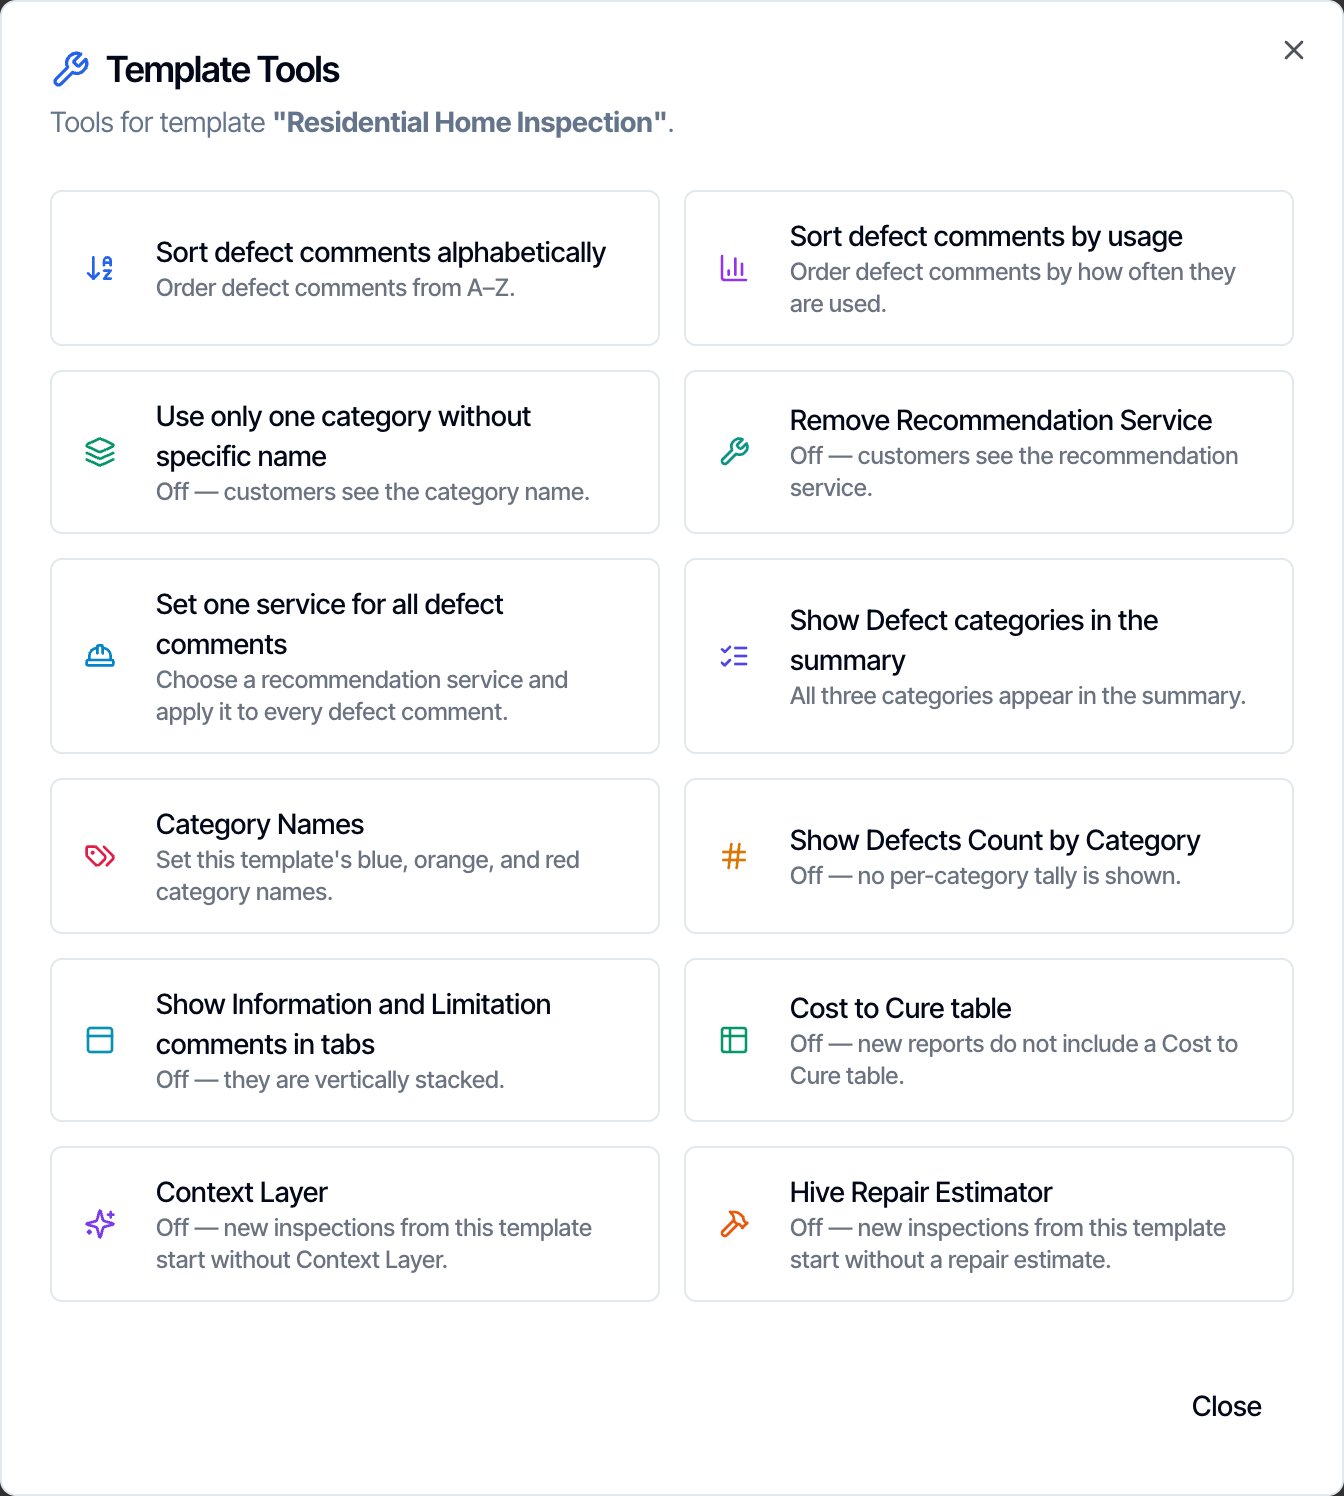
- The line under Cost to Cure table shows whether new reports from this template include the table.
Turn it on and save
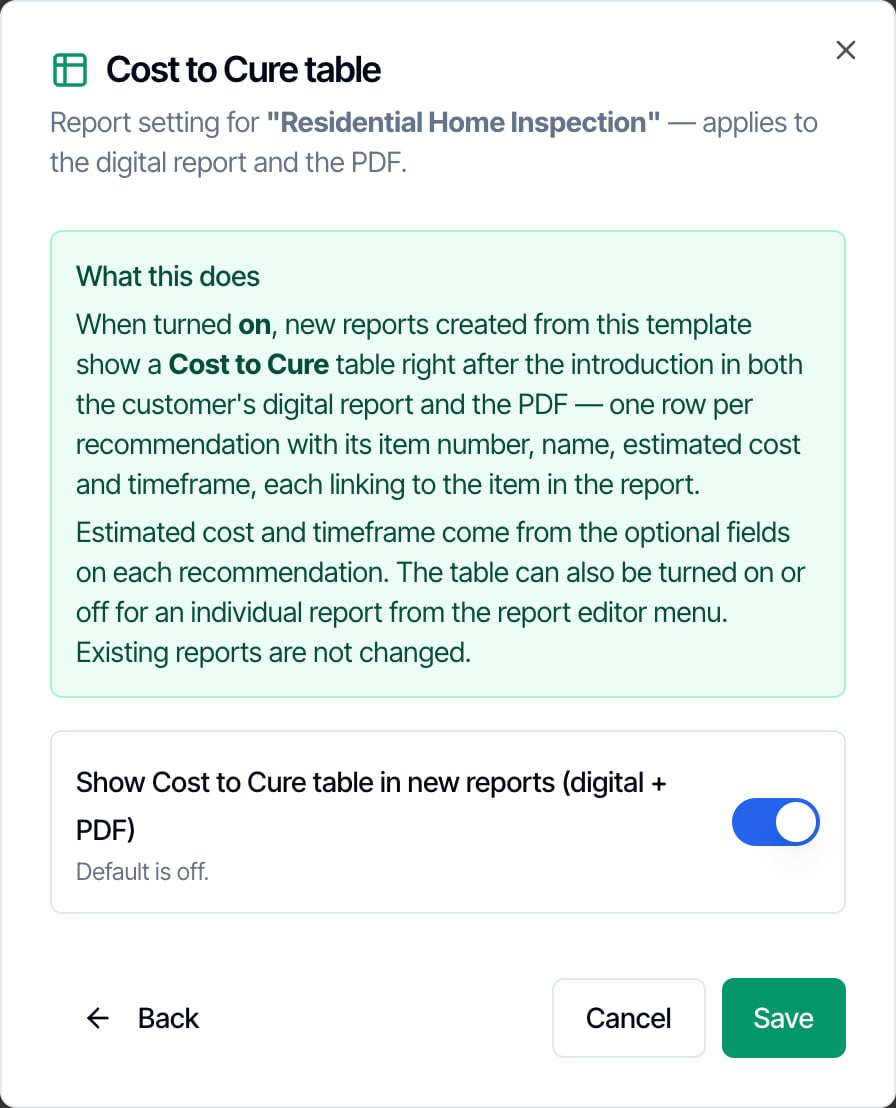
- Turn on Show Cost to Cure table in new reports (digital + PDF).
- Click Save.
The template switch sets the starting point for new reports, whether the inspection is created on the web or in the mobile app. Reports that already exist keep the setting they had. Change those one at a time in Report Tools.
Turn it on or off for one report
Use this for a report that already existed when you changed the template, or to add or remove the table on a single job.Open Report Tools

- Open the report in the Web Editor.
- Click the three dots in the toolbar, between In-Report Photo Bank and Save.
Click Cost to Cure table
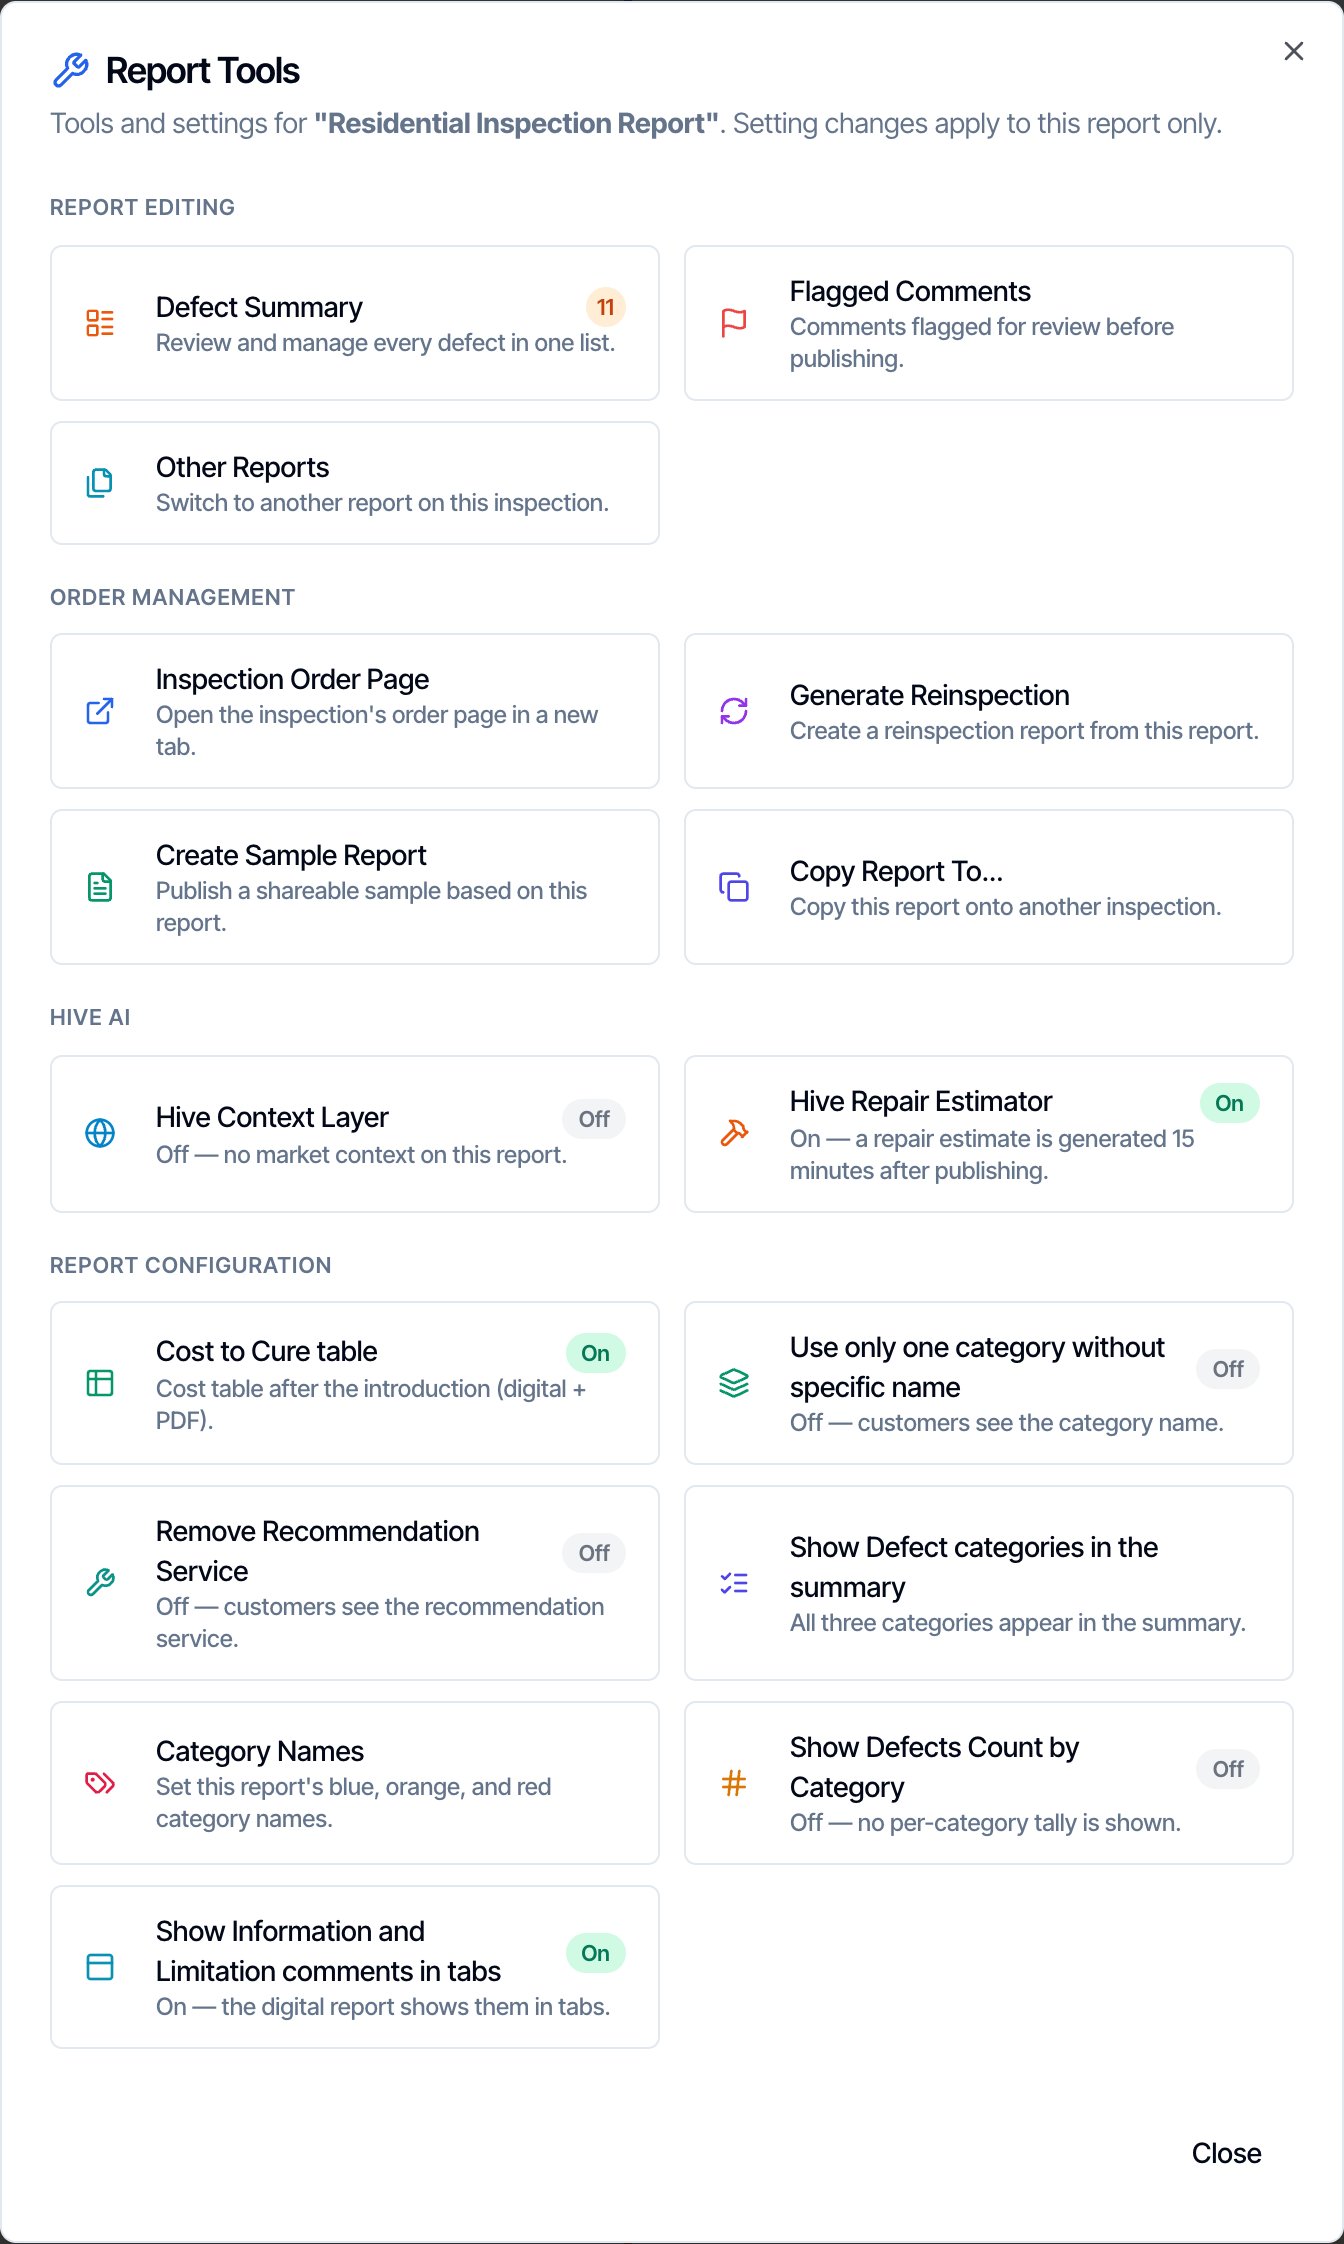
- It is the first tool under Report Configuration. The badge shows On or Off for this report.
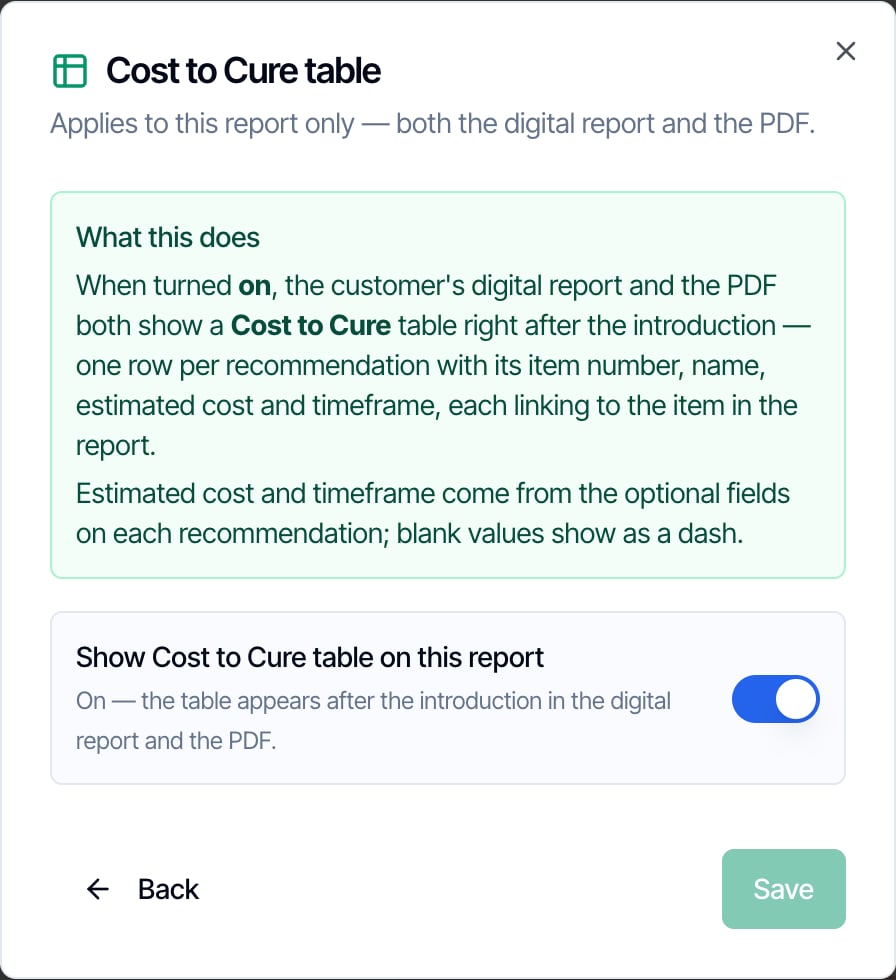
What your client sees
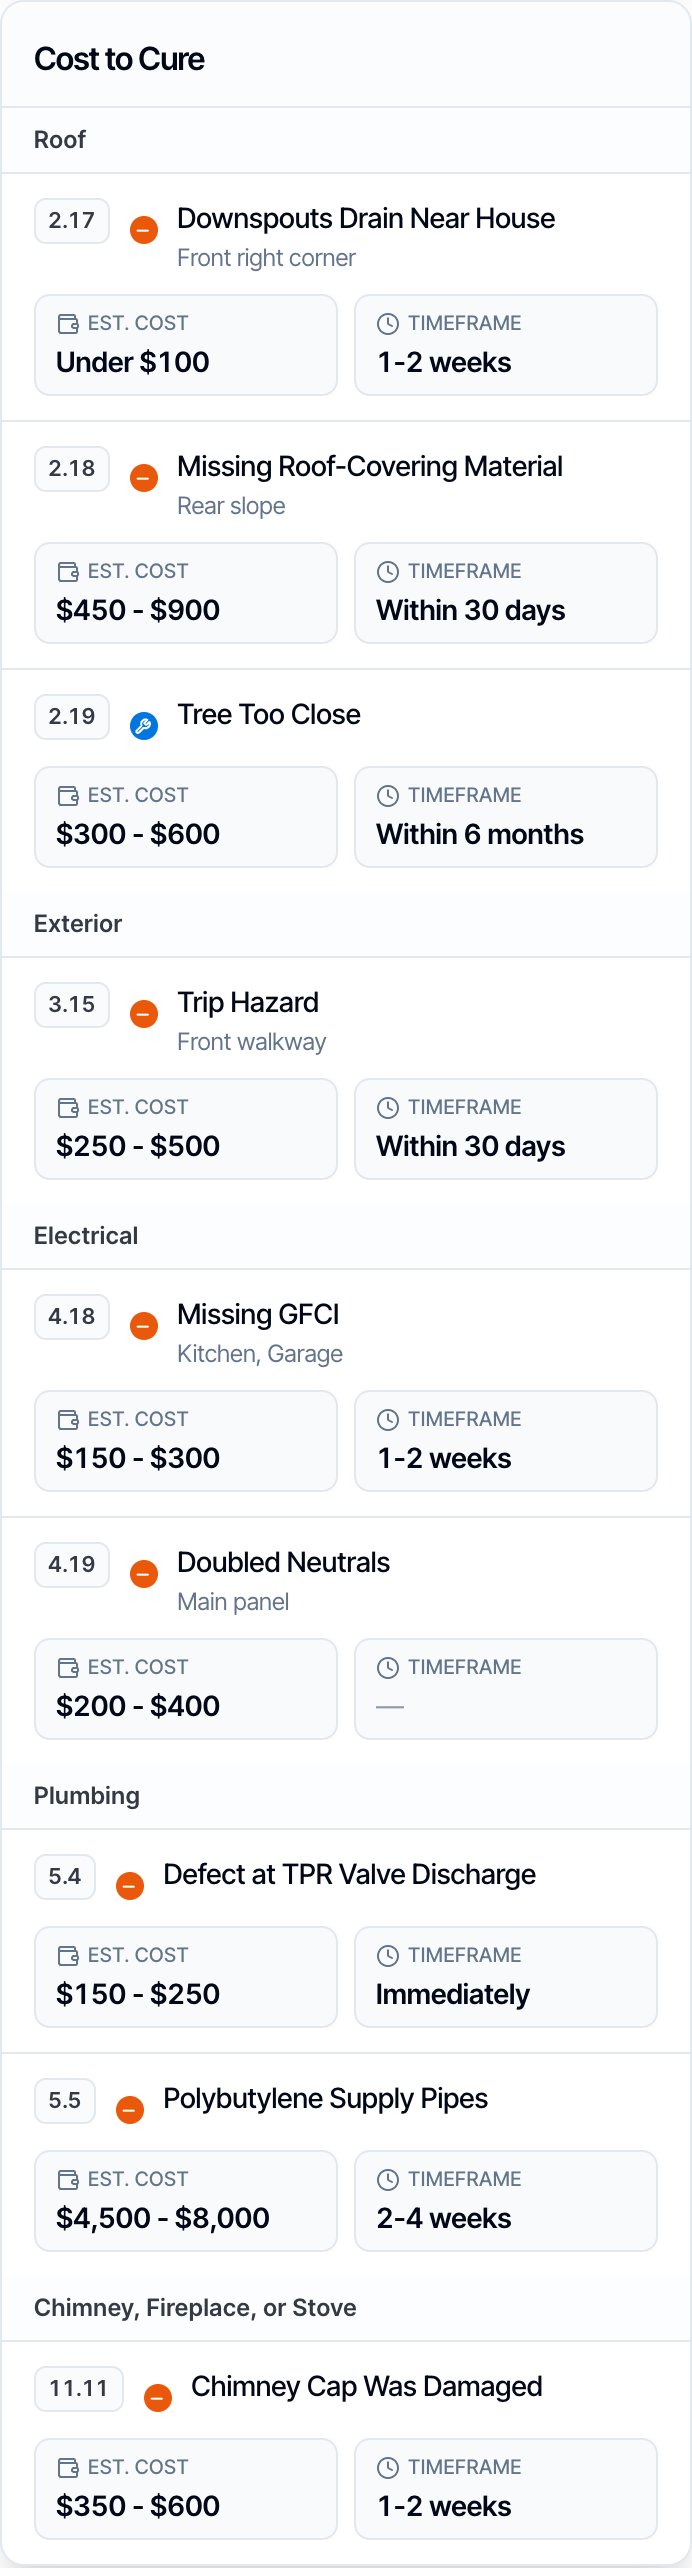
The table sits right after the report introduction, before the defect summary and the report sections. Your client does not have to do anything to see it. In the digital report- On a computer or tablet it is a table. On a phone each defect becomes its own card, so nothing scrolls sideways.
- Clicking a row jumps to that defect, with its photos and full description.
- The table comes after the introduction. On a long report it continues on the next page with the column headings repeated.
- The item number and name are links to the defect inside the PDF.
Which defects are in the table
- Only defects you priced. A defect is listed when it is selected in the report and has an Estimated Cost.
- No cost, no row. A defect with an empty cost is left out, even if it has a timeline. It still appears in the body of the report as usual.
- An empty timeline is fine. The row is listed and the Timeframe column shows a dash.
- Any text counts as a cost. $0, TBD and N/A all put the defect in the table. Only an empty field, or a field holding nothing but a dash, is treated as empty.
- Sections with nothing priced are skipped. If no defect in the report has a cost, the report shows no table at all, even with the switch on.
- All categories are included. The setting that hides a category from the defect summary does not hide it from this table.
Worth knowing
- There is nothing to enable for your company first. The switch is in every template and every report.
- No totals. Costs are text, so Hive does not add them up. If you want a total, type it in the report introduction.
- The table is not shown everywhere. It is in the full digital report and the full PDF. The Summary view, the summary PDF and reinspection reports don’t include it.
- Web only for the switch. Template Tools and Report Tools are in the web dashboard. You can type costs in the mobile app.
- Turning the table off does not remove your costs. They still show on each defect. To remove a cost, clear the field on that defect.
- Your costs also show on the repair addendum. When an agent adds a priced defect to a repair addendum, your estimated cost and timeline are listed with it.
- Saving a comment to your template keeps its cost. See Save comments to template.
- Changes after publishing. Edit the cost in the report and save. The digital report shows the change right away. The PDF shows it the next time the PDF is generated.
FAQ
How is this different from the Hive Repair Estimator?
How is this different from the Hive Repair Estimator?
Cost to Cure shows the prices you type, inside your own report. The Hive Repair Estimator is a separate PDF where Hive AI prices every defect for the local market. You can use either one or both. See Send a repair estimate.
Why is a defect missing from the table?
Why is a defect missing from the table?
Check two things. The defect must be selected in the report, and its Estimated Cost must have something in it. A defect with only a timeline is not listed.
I turned the switch on but there is no table. Why?
I turned the switch on but there is no table. Why?
The table only appears when at least one selected defect has an estimated cost. Add a cost to a defect and the table shows. Also check you are looking at the full report, not the Summary view.
I turned it on in the template but an existing report has no table.
I turned it on in the template but an existing report has no table.
The template switch only applies to reports created afterwards. For an existing report, open it in the Web Editor, click the three dots for Report Tools, open Cost to Cure table, turn the switch on and click Save.
Do I have to price every defect?
Do I have to price every defect?
No. Both fields are optional. Price the defects you want and leave the rest empty. Only priced defects are listed in the table.
Can I show a cost on a defect without showing the table?
Can I show a cost on a defect without showing the table?
Yes. Leave the Cost to Cure table switch off. Each priced defect still shows its own estimated cost and timeline in the report.
Does the table add up a total?
Does the table add up a total?
No. The cost field is plain text, so you can write a range, a single number or a note. Hive shows it as typed and does not total it.
Can I use the mobile app?
Can I use the mobile app?
You can type Est. Cost and Est. Timeline on any defect comment in the mobile app. Turning the table on or off is done on the web, in Template Tools or Report Tools.
Can clients tell these are my estimates and not quotes?
Can clients tell these are my estimates and not quotes?
The table is titled Cost to Cure and the columns read Estimated Cost and Timeframe. Hive does not add a disclaimer. If you want one, add a sentence to your report introduction, which sits right above the table.
Related
Send a repair estimateLet Hive AI price every defect by contractor trade in a separate PDFCreate a repair addendumLet clients and agents pick defects from the report and build a repair requestSave comments to templateSend a comment you wrote in a report back to your templateEdit and publish reportsReview, edit and publish a report in the Web Editor